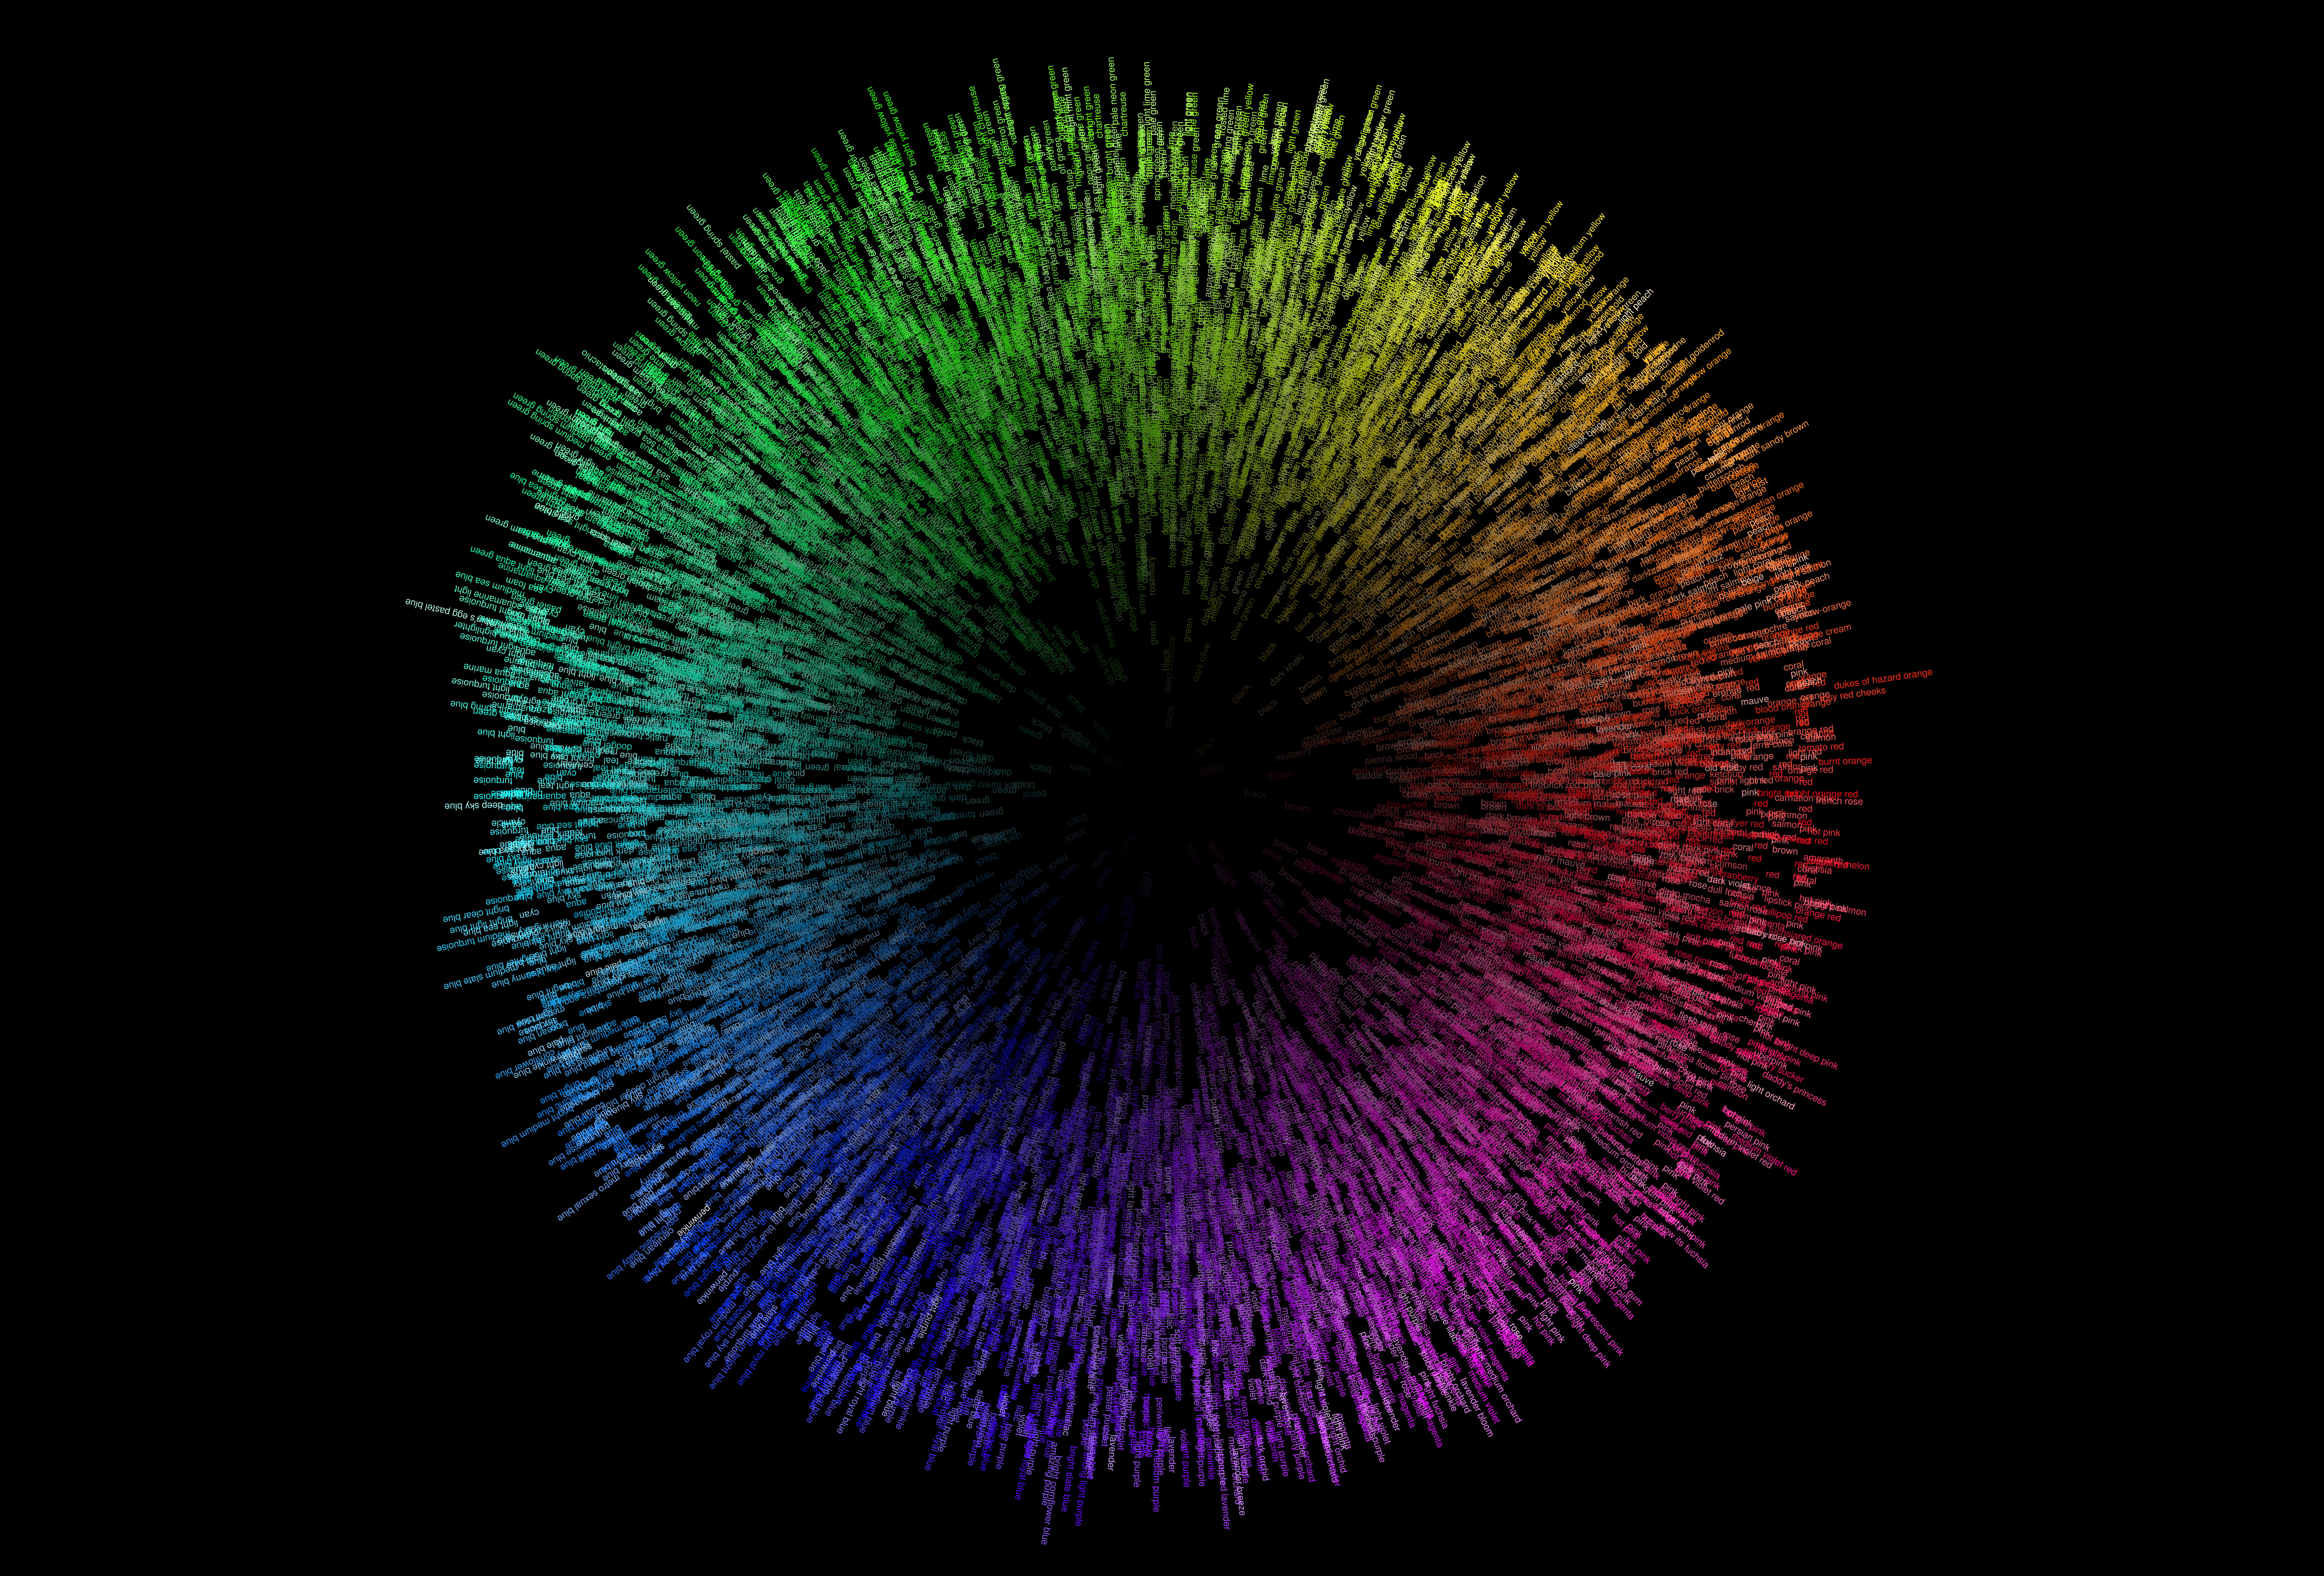
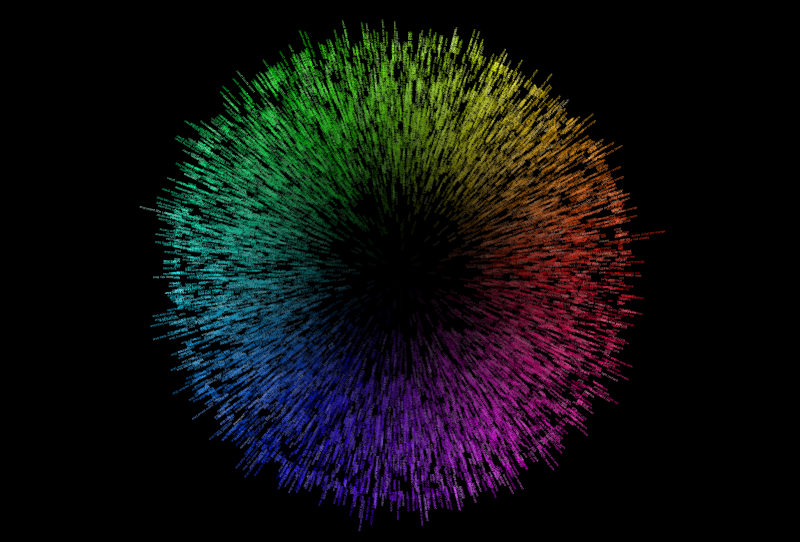
In 2008 I created a visualisation of 10,000 colour names by plotting the names in their colour on a circle. The angle of the name represents its hue, while the distance from the centre of the circle to the centre of the name represents the value of the colour in the HSV colour space.
I sourced my colour names and corresponding values from a CSV released by Dolores Labs, after an experiment they ran. More details about that can be found on their website. View the colour wheel as a 300KB PDF. (The PDF contains 10,000 items of text and takes a considerable time to render in Adobe Reader - even on a fast machine) View the colour wheel as a 17MB 10000x10000 pixel JPG. Work-in-progress screenshots of the colour wheel.
Licence
The generator uses PDFlib Lite 7.0.3, which is not open source. Running it needs a commercial licence unless an exemption applies, and each user needs their own exemption. The licence for the colour names data is unknown. See the licence page for details.